Beginning malware analysis
A guide to the basics of malware analysis and reverse engineering.

This guide will show you the basics of how to analyze and reverse engineer malware in a safe way, including basic static analysis, dynamic analysis, and report writing. That said, follow this guide at your own risk. First, you need a lab built out with the tools and infrastructure to reverse engineering. I wrote a separate post about that, so follow that guide first, then come back here.
Safe sample handling
Outside of analyses VMs, malware samples are stored in password-protected .zip or .7z archives. This prevents the accidental detonation of the sample, and prevents triggering anti-malware products when samples are stored or shared. By convention, the password is usually the word infected, although the word malware is sometimes used instead.
The sample should only be extracted from the archive file on a system designed to analyze malware.
Obtaining malware samples
If you are fortunate enough to work in a Security Operations Center (SOC), chances are you can find some malware samples in reported phishing emails or AV quarantines. If not, check out MalwareBazaar.
Initial static analysis
In static analysis we look at the malware as it exists on disk without executing it.
Windows Portable Executable (PE) files typically have these sections:
| Name | Description |
|---|---|
| .text | Contains executable code |
| .rdata | Contains read-only data |
| .data | Contains data |
| .reloc | Contains relocation data to help resolve memory addresses |
pestudio
The pestudio tool on Windows gives you quick information about by simply dragging and dropping a file into its interface.
Here are some key areas to note:
- The SHA256 hash
- The compiler timestamp (shows when a sample was built - although that can be spoofed)
- VirusTotal results (it checks via file hash and does not upload the sample)
- Imports (imported functions)
- Strings
pestudio will group each imported function by what it is used for (e.g, registry, reconnaissance, network, etc.), and flag functions that might be used for evil. The strings page has a similar layout.
Scroll through the Strings list to look for anything that might be unique to that malware sample or its author.
Code emulation
Code emulators attempt to provide a preview of how a program uses API calls, without actually running the code. They don’t replace debuggers or disassemblers, but they can provide clues about where to start looking at a program with other tools.
REMnux includes a few different emulators, including Speakeasy, capa, binee, Qling, and Vivisect. If an emulator doesn’t give you the answers you need, try another one.
CAPA
CAPA is a tool that will attempt to emulate a program and map its functions back to the MITRE ATT&CK and MBC frameworks.
Use the option
-vvand redirect to a file to get more details, including the location of each pattern identified in the sample.
FLOSS
FLOSS is a tool that attempts to emulate a program to reveal strings that are built at runtime. It’s not always successful, but it is always worthwhile to note if it found obfuscated strings.
Speakeasy
Speakeasy is a emulator for windows PE files. To output execution details of evil.exe to speakeasy.json, and a human-friendly list of calls to speakeasy.txt, run:
1
run_speakeasy.py -t evil.exe -o speakeasy.json 2> speakeasy.txt
Parse JSON via CLI
While not required, jq is a neat tool for parsing JSON via CLI. For example, to get a list of all API calls in speakeasy.json, run:
1
jq ".entry_points[].apis[].api_name" speakeasy.json
Identifying packed executables
Packing is a process that obfuscates the code that is on disk. When the executable runs, the code in unpacked in memory and executed in its original state. While packing techniques are often used by malware authors, packing can also be used for legitimate purposes, such as reducing a program’s size or protecting intellectual property.
Any one or more of the following conditions could indicate that a PE file is packed:
- Few, if any recognizable strings
- Additional or missing sections
- A modified Entry Point
- A large read-only data (
.rdata) section - A modified Import Address Table (IAT)
- High entropy (i.e., randomness of data)
Detect it Easy (DIE) and Exeinfo PE can identify some common packers. However, sometimes malware authors include indicators from other packers as a way of throwing off analysis.
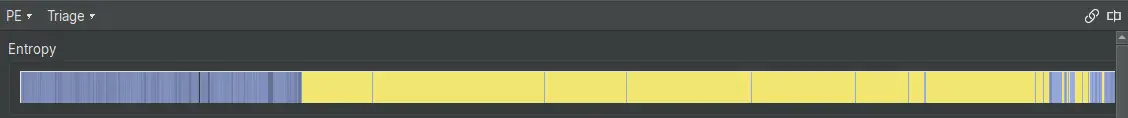
The sample analyzed in the screenshots has a large .rdata section with high entropy.
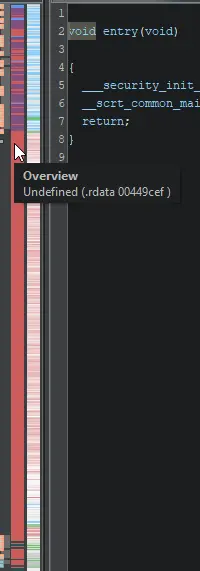
In IDA, packed files will often show a large unexplored section in the entropy bar.

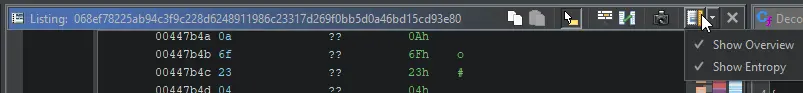
The entropy bar in Binary Ninja’s Triage Summary will show a large yellow section.
In Ghidra, you will need to enable the Overview Bar and Entropy Bar, which are disabled by default.
The bars in Ghidra are vertical.
I’ll cover manual unpacking in another post.
Basic dynamic analysis
In dynamic analysis we observe the activities of the malware as it’s being executed. Often dynamic analysis is done through an automated sandbox, but sometimes manual or semiautomatic dynamic analysis can produce better results by trying different conditions or overcoming anti-analysis checks.
Prepare the sample
- Copy the sample into your lab VM, but don’t run it yet! Or, if you’re investigating a URL, open a browser, but don’t navigate to the URL!
- Take a VM snapshot, so you can easily redo the analysis under different conditions if needed.
Resource starvation
Rather than giving malware access to a full suite of network services right away, running it without any resources (real or fake) can cause malware to reveal alternate behavior.
Network traffic simulation and interception
- Start
fakednsandinetsimon REMnux - Start capturing packets using Wireshark on REMnux
- Run the command
accept-all-ips startin REMnux to allow connections made directly to any IP addresses - Start Fiddler in the Windows lab to capture and decrypt any HTTPS traffic
Start capturing
- Run Autoruns, save the results, and close it
- Run Wireshark, start capturing (on REMnux if you are simulating internet connectivity, the router or bridged network adaptor if you have a dedicated egress for malware analysis, or as a last option, in the lab itself)
- Start Fiddler and minimize it
- Run regshot, take the first capture (may appear to freeze for a bit), and minimize it
- Start Process Monitor (Procmon) and minimize it
Detonate the sample
Double-click on the file or visit the URL. Interact with it the way a user would. Give the malware a long time to do evil things. Sometimes malware authors build in delays to evade analysis. Keep an eye on your analysis tools, and watch for any interesting behavior.
Once some time has passed, and interesting activity has been observed, take another snapshot for safekeeping until the analysis is complete, then continue.
Collect results
Save results to a folder where you can retrieve the files from REMnux.
- Export all of the Process Monitor (Procmon) analysis as a CSV, and close Procmon
- Take the second shot in regshot
- Click the Compare button in regshot
- Save the comparison text file that opens
- Save all sessions in Fiddler
- Save the packet capture in Wireshark as a
.pcapfile
Using ProcDOT
- Open ProcDOT
- Load the Procmon results CSV by clicking on the
…button - Optionally, load a PCAP file by clicking on the
…button for the WinDump field - Click the
…button for the launcher field, and select the first process involved, (i.e. the exe you clicked on, the program that was exploited, or the Office product that ran a macro) - Click the Refresh button
ProcDOT will display a graph of actions taken by that process and related processes. Review the graph for any interesting files or other artifacts, find them, and make a copy of them.
From the file menu, save the ProcDOT session to a .pd file
From the file menu, export interesting sections of the graph as .png image files.
Copy the results files from all of the tools and any interesting artifacts to REMnux, then restore the Windows lab system to the known good snapshot.
Review the results
Use the REMnux VM to write a report. I like using Markdown for easy formatting, which can be used to generate professional-looking PDFs. Store the potentially malicious artifacts in password protected .zip files with the password infected. Copy the .zip files and any notes to your host system for long-term storage.